Bicycle clinometerHills! Every cyclist will develop a certain sensitivity – an accute awareness of the dynamics of road inclinations. We learn how to best pace our efforts when climbing the hills on the commute or training round – and we will certainly "sense it" when the incline becomes too steep for the bike's gearing, or when we have simply overestimated our physical resources. But just how steep are those hills, in objective terms? Apart from the curiosity value, it would occasionally be useful to be able to know the real figures, so that we may develop a intuitive grasp of what it takes to climb a steep road of a certain grade. When planning an itinerary for a cycle tour in some hilly region, for instance, it is natural to scrutinise available topographical maps for information about the terrain. Often we want to evaluate the relative steepness of alternative roads under consideration, and it may then be possible to gain a useful impression of the large-scale gradients by counting the transverse contour lines on a given stretch of road. Unfortunately, such exercises can rarely reveal the actual variation at a smaller scale. Arithmetric expressions such as 1:10 (10%) or 1:5 ( 20%) doesn't mean very much anyway, unless we have something familiar to relate them to. What we want is a "conditioned sensitivity", and this could arguably only be won through personal experience of slopes which has surveyed grades of different magnitudes. Many GPS enabled bike computers can save data for generating topographical profiles. However, elevation data derived from GPS observations (that is vertical sensing along the Z-axis) is in fact, and for various technical reasons, inherently quite imprecise and ”coarse-grained”, also when compared to the usual limited precision of consumer grade GPS horizontal positioning (sensing along the X/Y, or Lat/lLon axes). A road's grade is basically calculated as the ratio between vertical distance gained (or lost) to distance travelled horizontally, and as we are mostly interested in grades where the latter dimension may be 10 or 20 times as great as the former, it is particularly unfortunate that it is the ratio's numerator unit, the altitude difference, which may have the worst precision. The consequence is that any small discrepancy in the altitude estimation input will be amplified, as it were, in the resultant angular calculation output. To develop a realiable judgement of what constitutes a slope of a certain steepness then, one would ideally need some sort of angle meter which could be read in real-time. And – surprise, surprise! – it turns out that such an instrument can easily be made using a cheap (but very capable) integrated accelerometer/gyrometer sensor chip and an equally cheap microcontroller. The buildI began by sourcing a suitable project container. It had to be small, watertight, and made of a clear material so that an enclosed digital display could be easily viewed. A handy ”Durable Outdoor EDC Waterproof Container Storage Case PC Box Camping Holder New” (sic) was found on ebay and fit the bill. As it has a matt frosted type of surface, a clear "window" area had to be polished out. 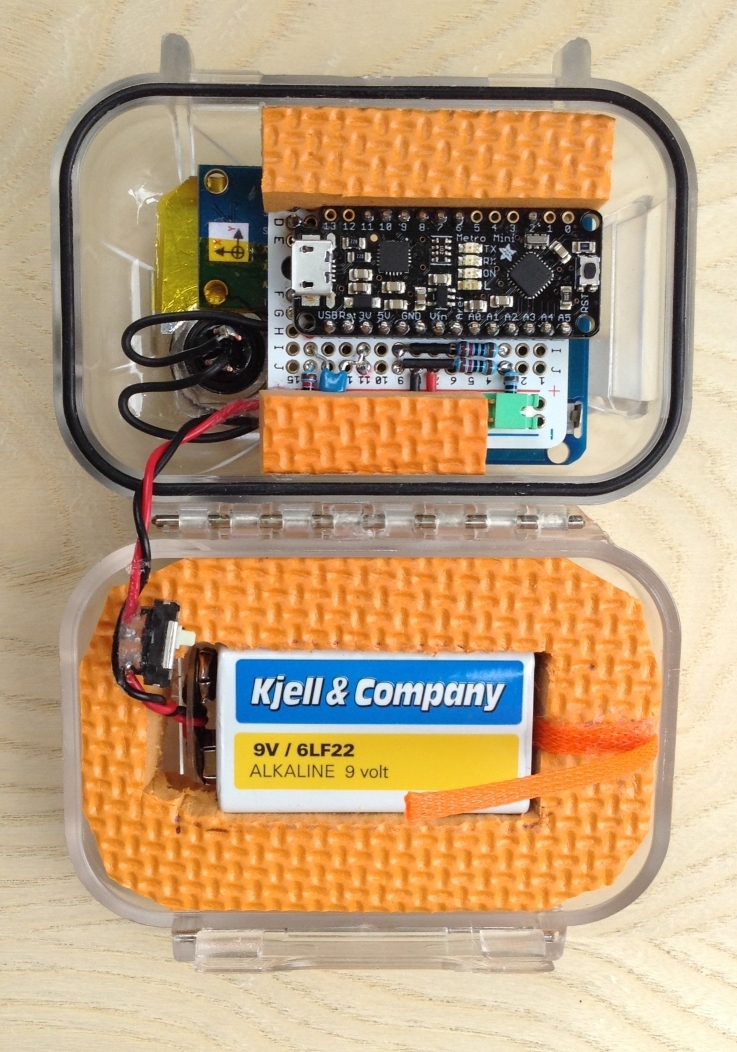 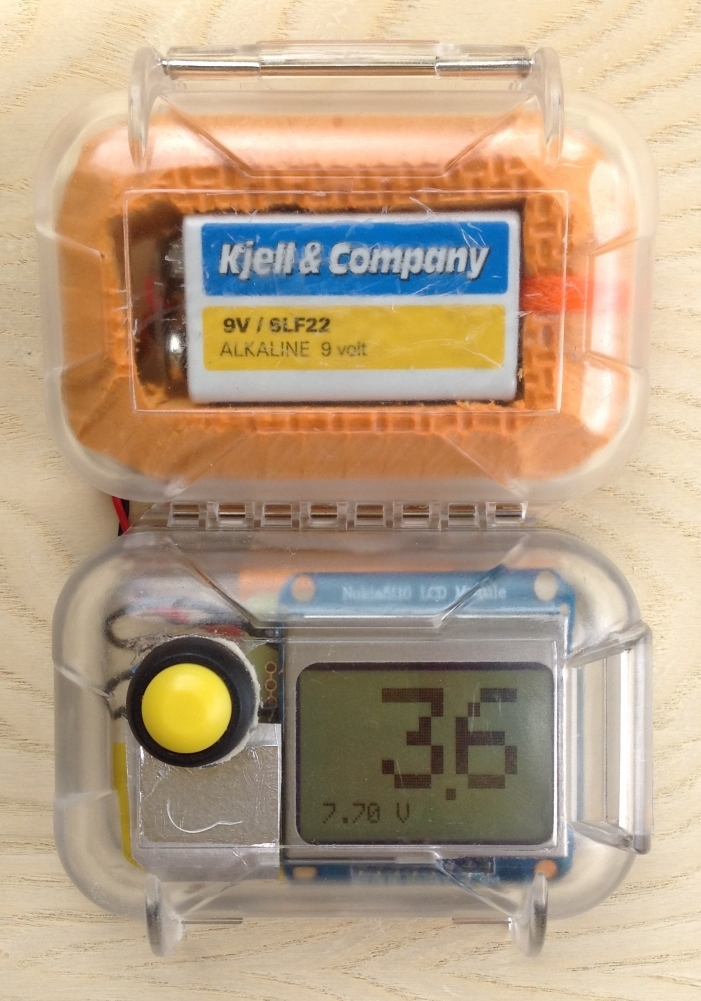 The sensor used for this project is the popular MPU6050 six-axis gyro + accelerometer combination from InvenSense. It came mounted on a small breakout board. The µC is the Metro Mini, an Arduino UNO derivative from Adafruit set to operate at 3.3 volts, and the display is the ubiquitous ”Nokia 5110” LCD screen. All the parts were assembled on a Perma-Proto quarter-sized PCB, also from Adafruit. 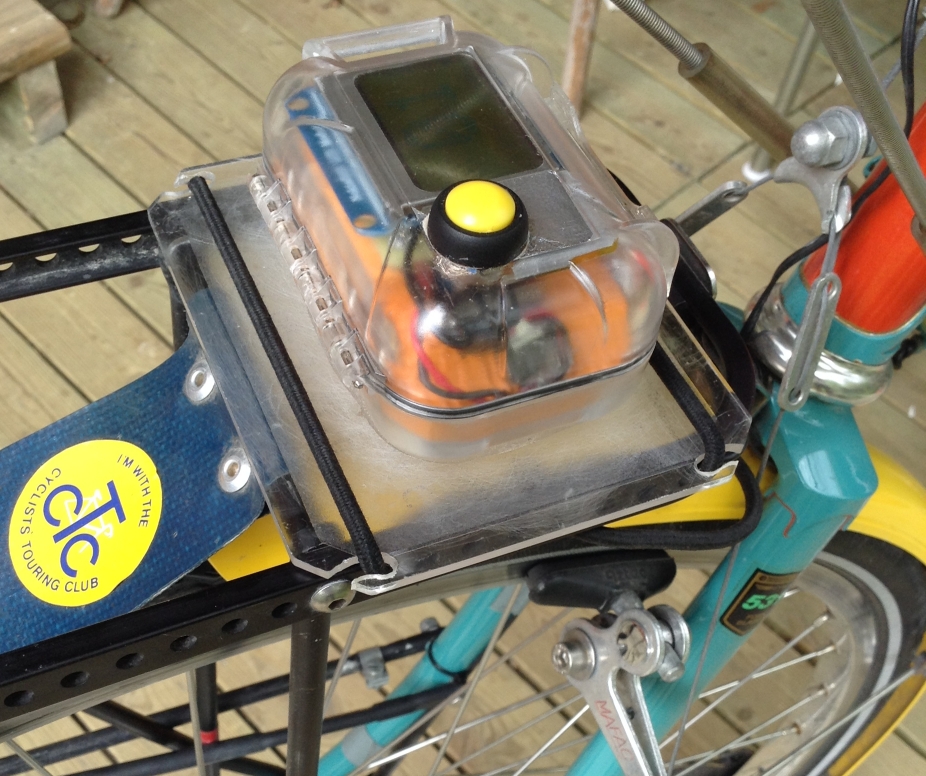 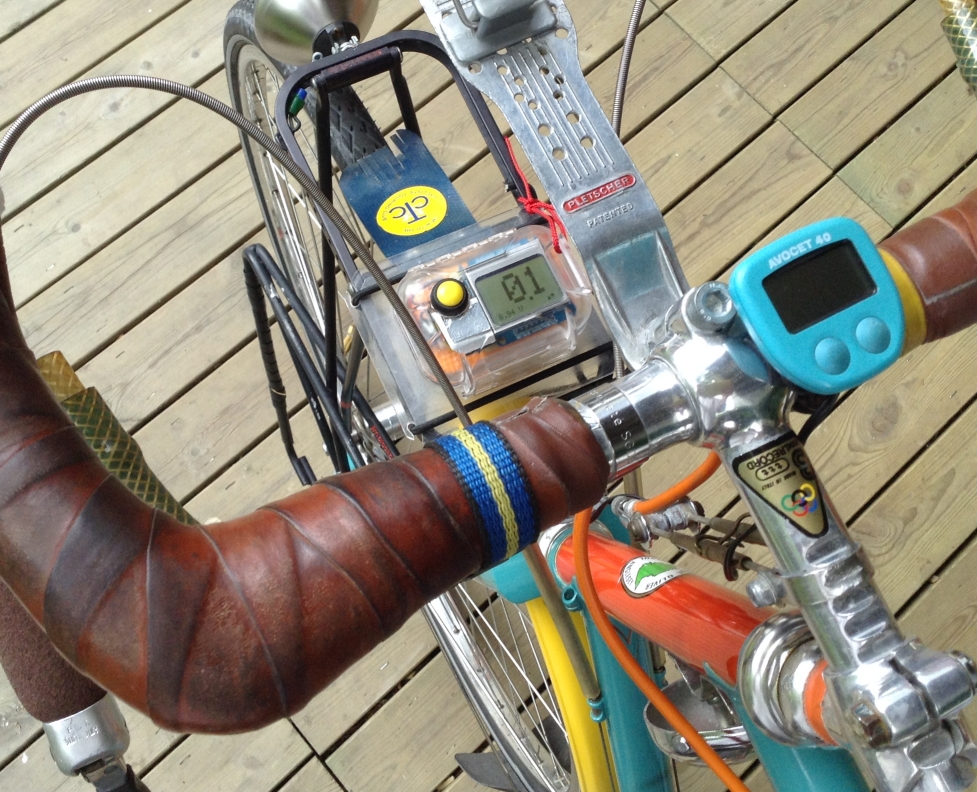 The firmwareThe MPU6050 has a sophisticated built-in Digital Motion Processor which takes care of most of the maths-intensive sensor data integration and spits out directly usable data over I2C to the Arduino. In this simple application we basically only need to track the tilt of one of the axes, the accelerometer's z-axis, which means only a fraction of the chips full capacity is being utilised now. (Actually, the MPU6050 library follows convention here and "pitch" is measured around the y-axis and "roll" around the x-axis, but because of the way that the sensor's carrier board fitted best to the base PCB the chip is turned 90 degrees, and hence we must use the "roll" values instead.) To get to know this rather remarkable sensor, you're adviced to spend some time studying it's datasheet! 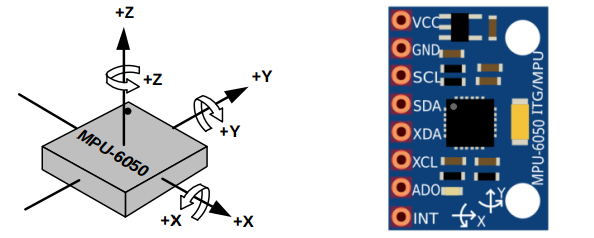 With the aid of the dedicated MPU6050 library written by Jeff Rowberg it was a quick job to get a prototype clinometer working for bench testing. And it worked, just like that! Hooray! It was, however, evident that my original approach of using only a single sample per second (which matches the update rate of the LCD screen) made the output much too sensitive to the small cyclic accelerations that are more or less unavoidable during the pedal stroke. Here is a link to an interesting analysis of the actual magnitudes of the power-curve during these approximately sinusoidal speed variations. One conclusion of that study is that the momentary bicycle speed variation during a typical pedal revolution is in the order of a couple of percent above and below the average (indicated) speed. But even this small variation seems sufficient to fool the accelerometer into "believing" it is being tilted back and forth a few degrees. 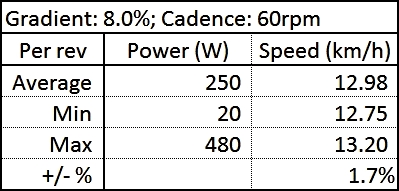 (chart fron Alex Simmos' blog) To solve, or at least minimise, the influence of both cyclic and random forward/rearward acceleration forces, the number of samples was increased to 10 per second (10Hz), which also meant approximately 10 samples per pedal revolution, since the normal cadence (at least for me) when climbing with a fully loaded touring bike hovers around 60-75 rpm. The sum of the sampled values is finally divided by 10, which smooths the output values considerably, while still being reasonably responsive, given the self-imposed constraint of the 1Hz display update rate. I find the notion of percent more intuitive than either fractional ratios or angular degrees, so the display presents the grade as the percentage of the rise over the run (to use the technical terms). If you are curious about clinometry or the subject of measuring and geodesically defining slopes this Wikipedia article is a good starting point. 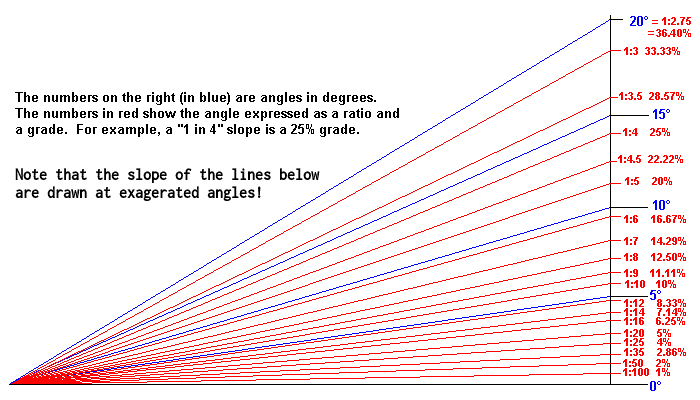 (image from www.1728.org) The display always shows the percentage figures as positive values, with one decimal. This is mainly to save space on the small screen; hopefully there shouldn't be much confusion whether we are going uphill or downhill because of this! The LCD additionally shows the voltage of the battery, while towards the lower right corner of the screen the present calibration stage is indicated. 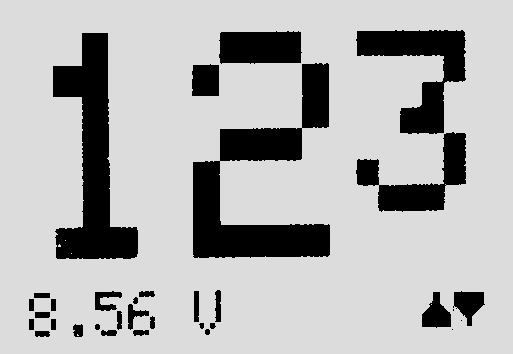 The schematic 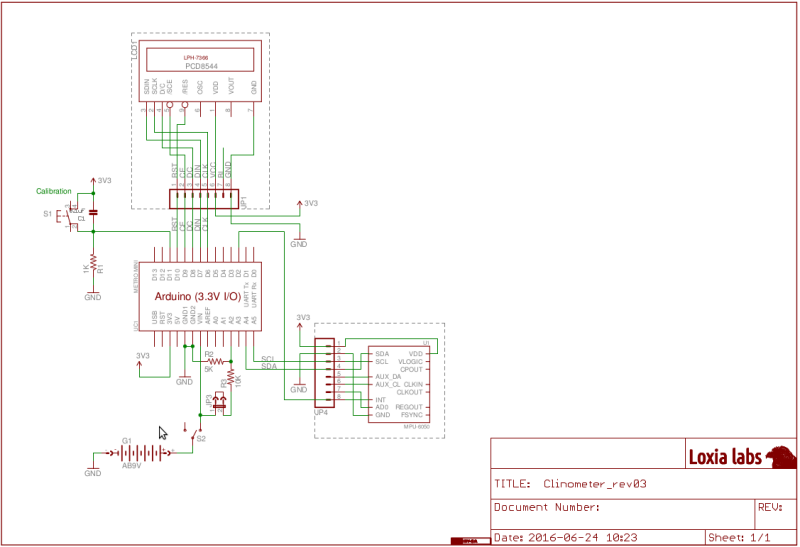 CalibrationEven though the sensor keeps its internal calibration fairly well, from one session to another, and stabilises at the correct value about 20-25 seconds after power-on, it is still necessary to calibrate the instrument when mounted on the bike, since it would be difficult to get it sitting exactly level every time. The calibration process is simple: First the bike is held standing straight and pointing in one direction of the road (not necessarily a level stretch). The yellow button is pressed which saves the first inclination value (in radians). The bike is then turned around to point in the other direction, while taking care to place the tyres in exactly the same spots, but mirrored so to speak. The button is pressed a second time, which saves the opposite inclination value. Half of the sum of these values is automatically saved as a correction offset value for adjusting all subsequent calculations. 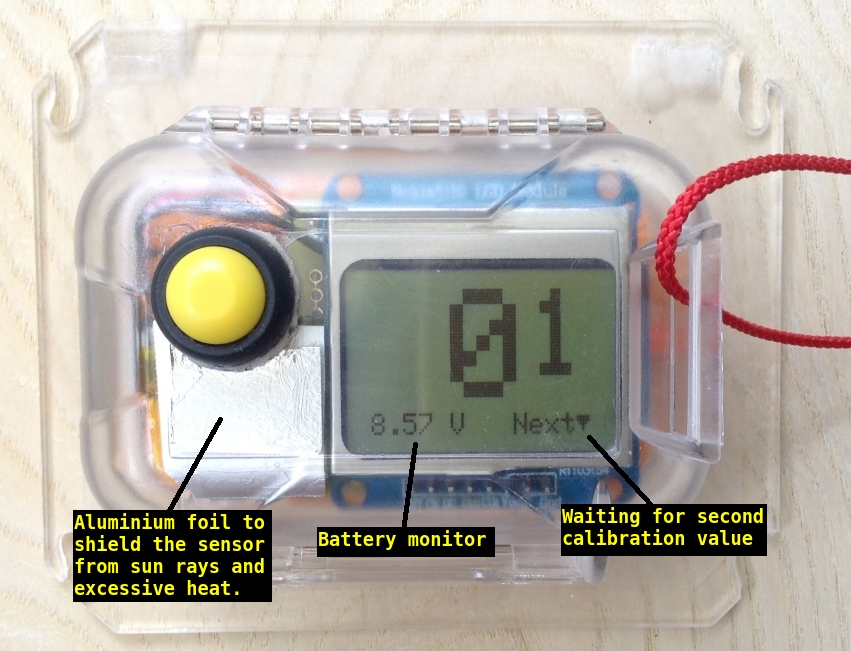 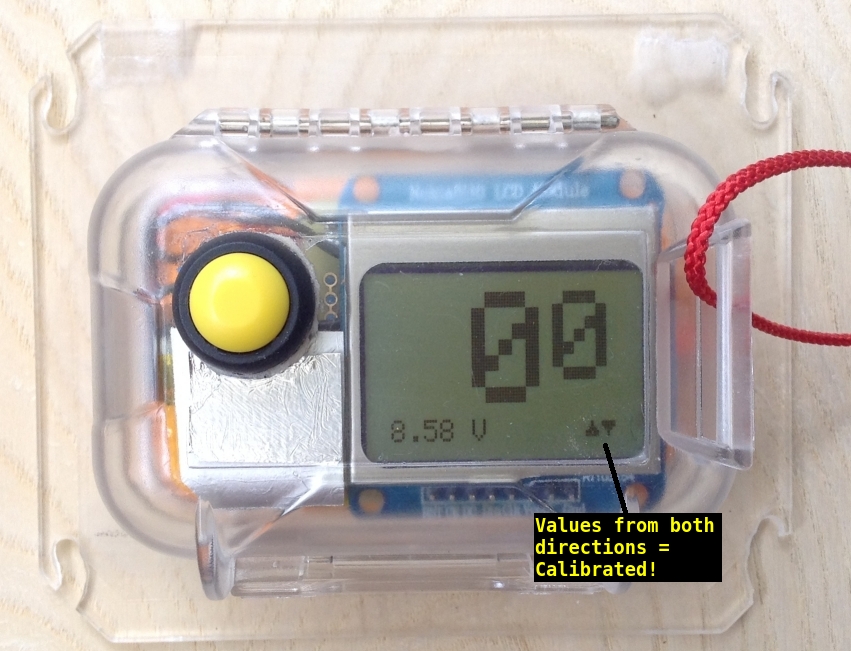 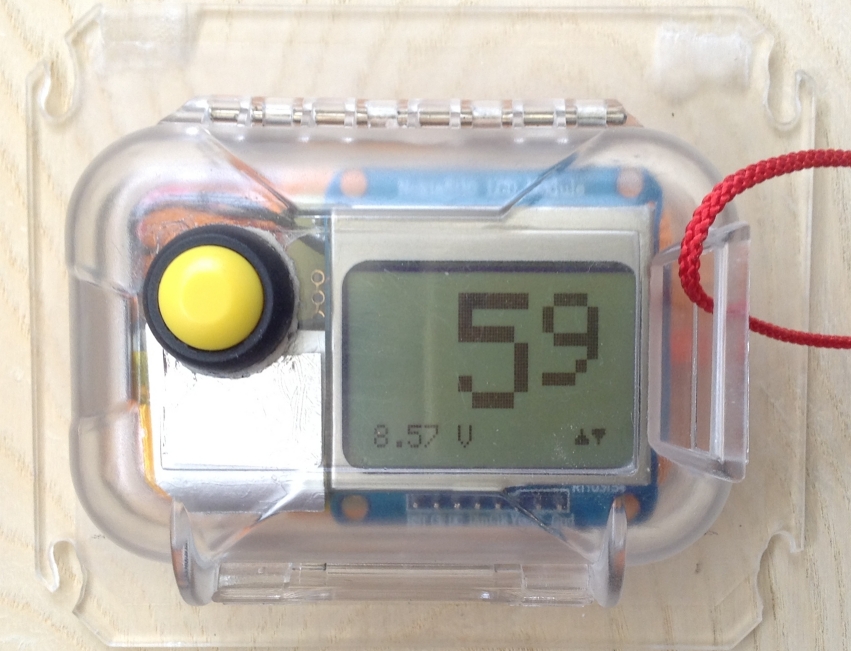 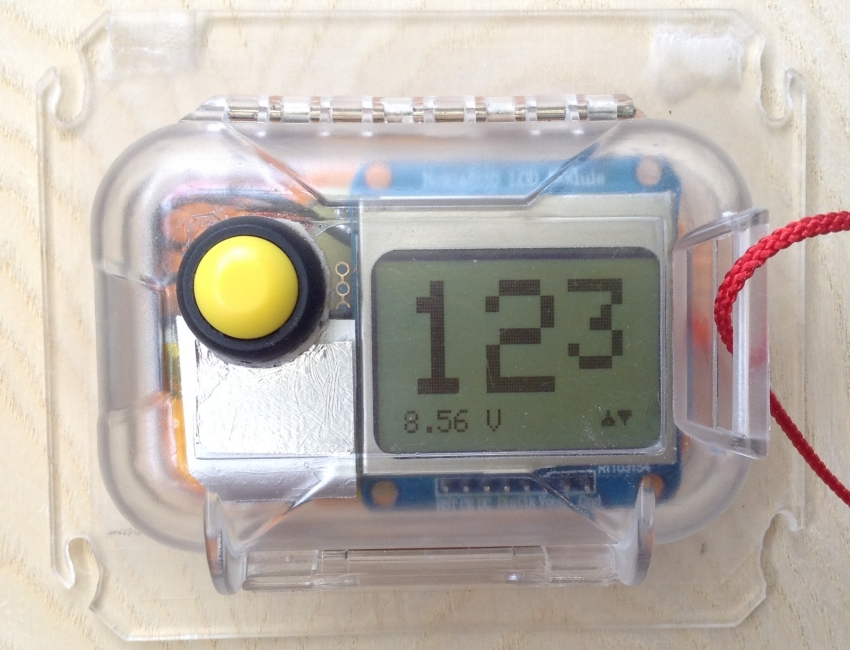 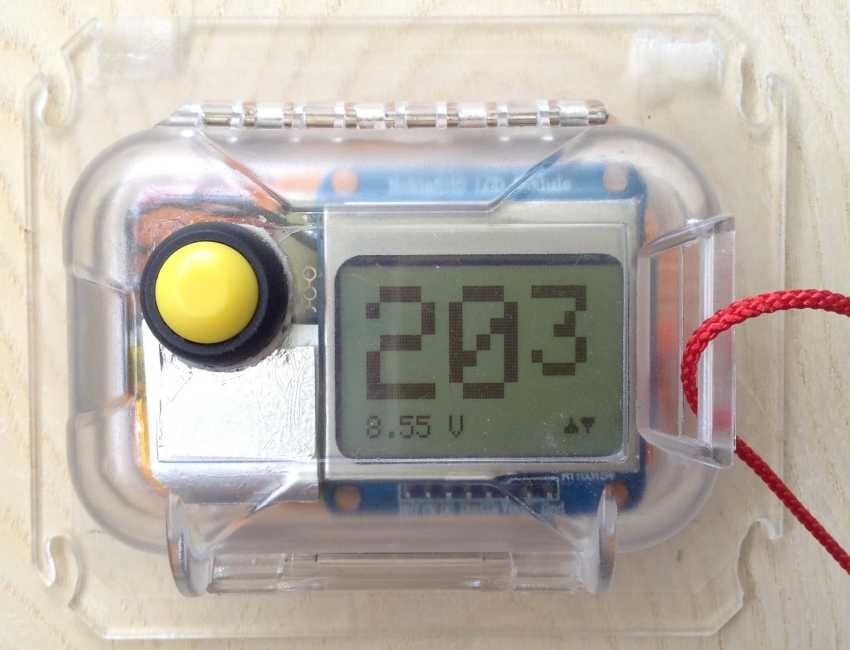 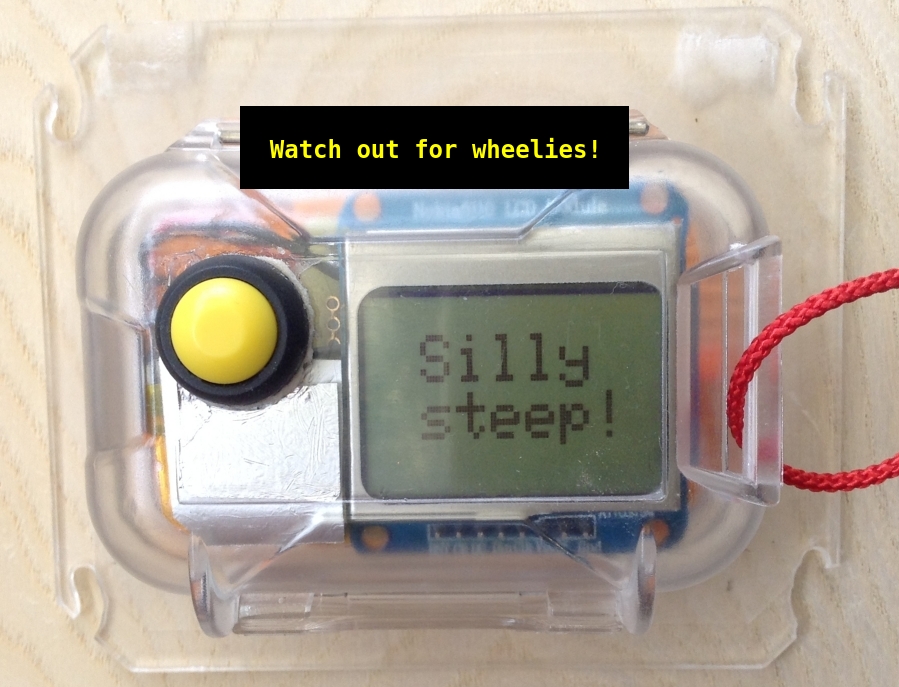 Comments  You may mail me here: xneb.contact@gmail.com Resources Source code files can be found in the Github repository: https://github.com/moof-moof/bicycle-clinometer |
 | |
