A variometer for thermal soaring models (version 1)This is a short account of our first attempt at building a lightweight variometer that could transmit a reliable real-time climb/sink feedback signal to aid in RC thermal soaring.
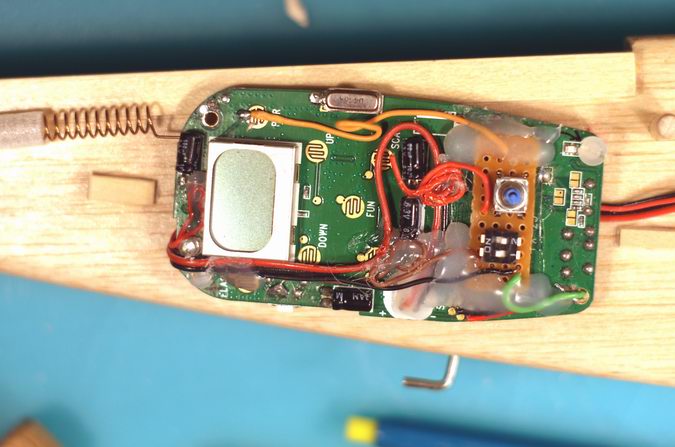
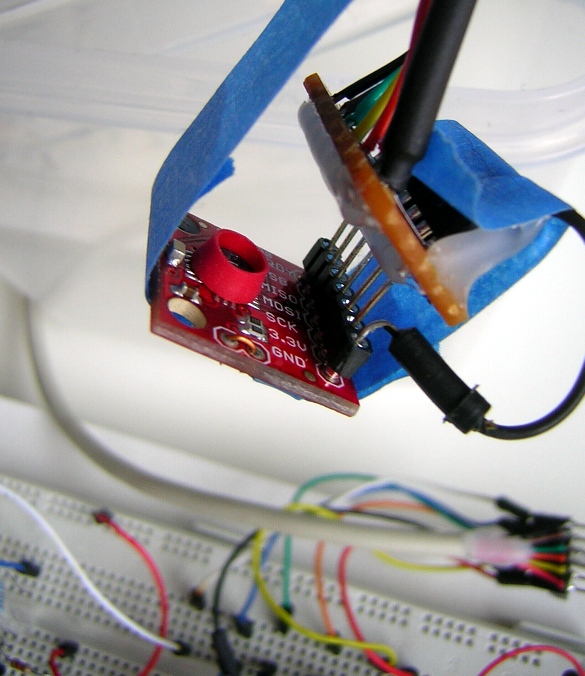
The variometer described is based on the VTI SCP1000 D01 pressure sensor (now discontinued) and the "Pro Mini" Arduino board (8MHz, 3.3V), both sold by Sparkfun. The prototype version relies on a piezo transducer to produce the audio signals in situ (pictured below). The beeps are then simply picked up by the microphone of an onboard PMR unit (446 MHz walkie-talkie) and monitored from a corresponding unit carried by the pilot on the ground. 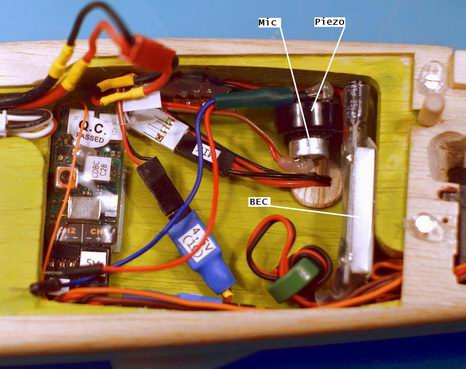 A later and lighter version uses a regular radio link to digitally transmit the signal values, and the audible beeps only then generated after reception on the ground. Hardware layoutInitial experiments utilized a standard Arduino Duemilanove, and the breadboard then resembled this Fritzing rendering : 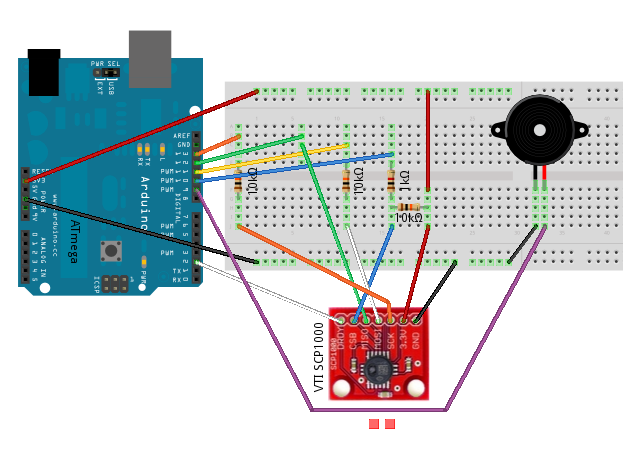 After substituting the Pro Mini board the entire circuit boils down to this schematic: 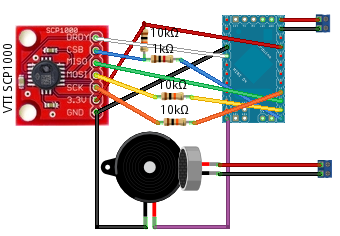 The glider's flight batteries supply the power (nominally 4.5v in this case), fed via the Arduino's built-in 3.3v regulation on the "RAW" pin. The Pro Mini is not equipped with an onboard USB connector so needs to be hooked up to the computer via an external solution like the FTDI USB-to-serial chip. This chip is offered either transplanted into a custom cable, or on its own breakout board. I chose the latter option, even though the pinout for that particular board (one of several models from Sparkfun) differs from that of the Pro Mini board. To this end an adaptor was made. Actually two variants with reversed patterns, so that the boards could be connected either "same side up", or in opposition. 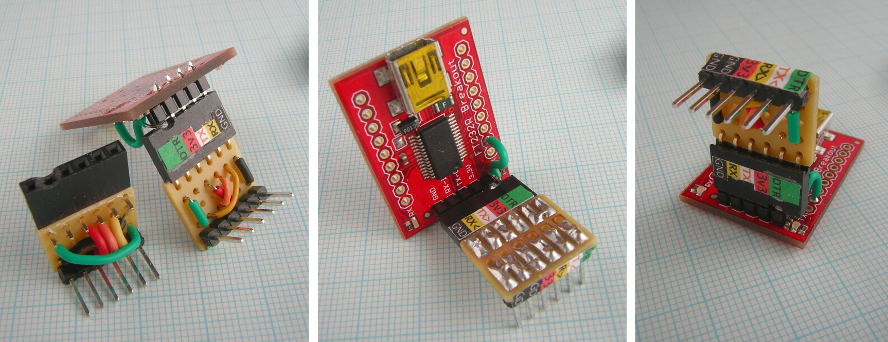 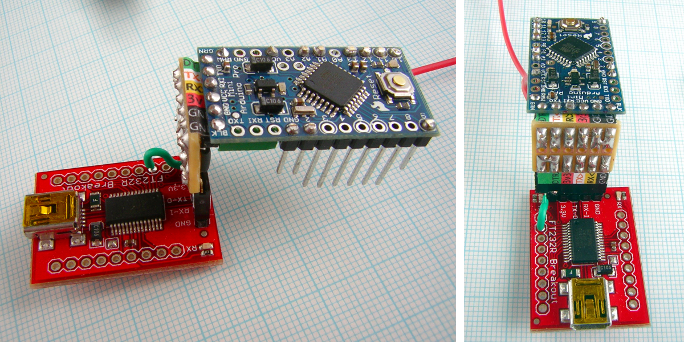 In order to make the finished vario as physically compact as possible a custom "shield" was crafted. This sits between the Pro Mini board and the SCP1000 breakout board. In the picture below the Pro Mini's engaged pins are designated by blue letters while the pinout of the sensor's BOB are shown in red. 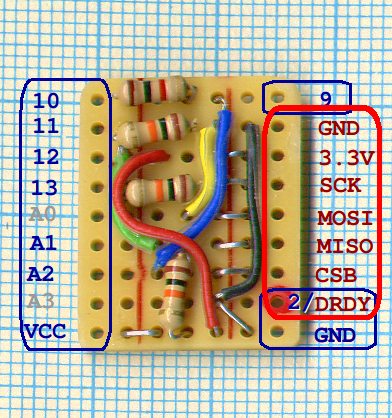 The empty shield is tested for size. Mounted like this (with the soldering side up) the components fit exactly in between the headers! No space wasted here! 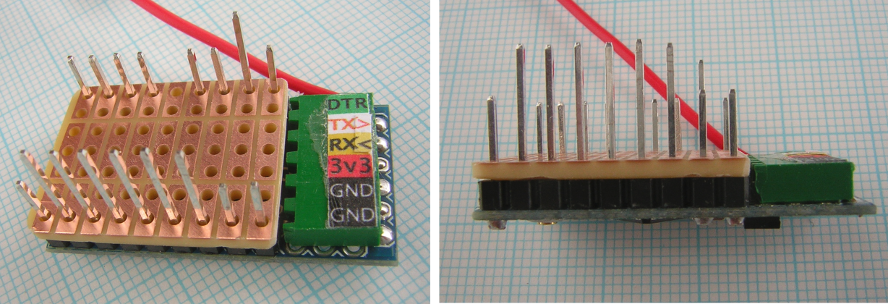 The complete assembly then looks like this. The sensor is covered by a black plastic "dome" (actually part of a pen cap) which keeps fingers and stray light away, but still allows air to pass through small holes drilled around its base.  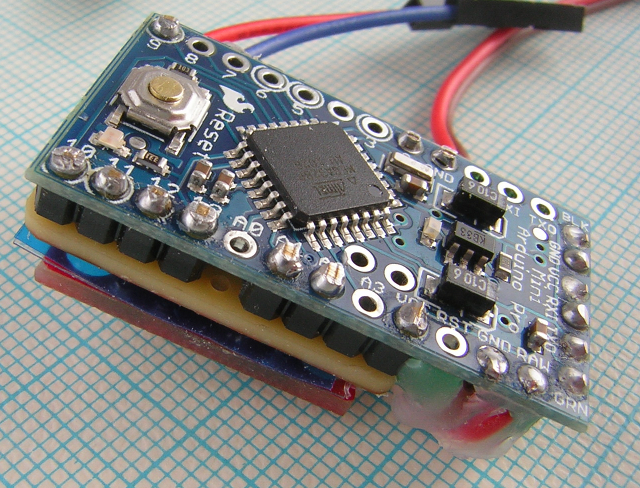 I generally like to house my projects in old-school cigar boxes, rather than bland plastic or tin cabinets. This little gadget measures only 34x19x14mm, though, so a box for very small cigars was called for! 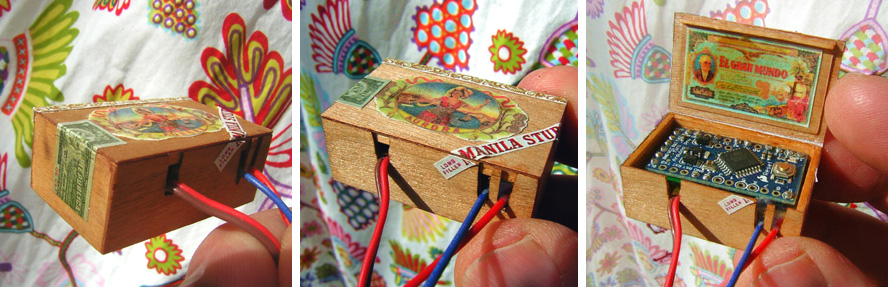 The softwareThe part of the Arduino sketch that interprets the barometric output from the SCP1000 sensor is adapted from various sources (c.p. the code header comments). For more information on the sensor model and its SPI interface, see this link [Sparkfun] and this [VTI]. Our variometer specific algorithm involves a couple of smoothing steps to filter out most of the signal noise, combined with an anti-hysteresis routine intended to provide a reasonable responsiveness and minimise output "stiction". The latest sketch version can be dowloaded here: Vario_SCP1000_mx07.pde. Pressure chamber testingIn order to develop the software and also for testing the hardware in the lab, a simple pressure chamber was assembled from "household" parts:
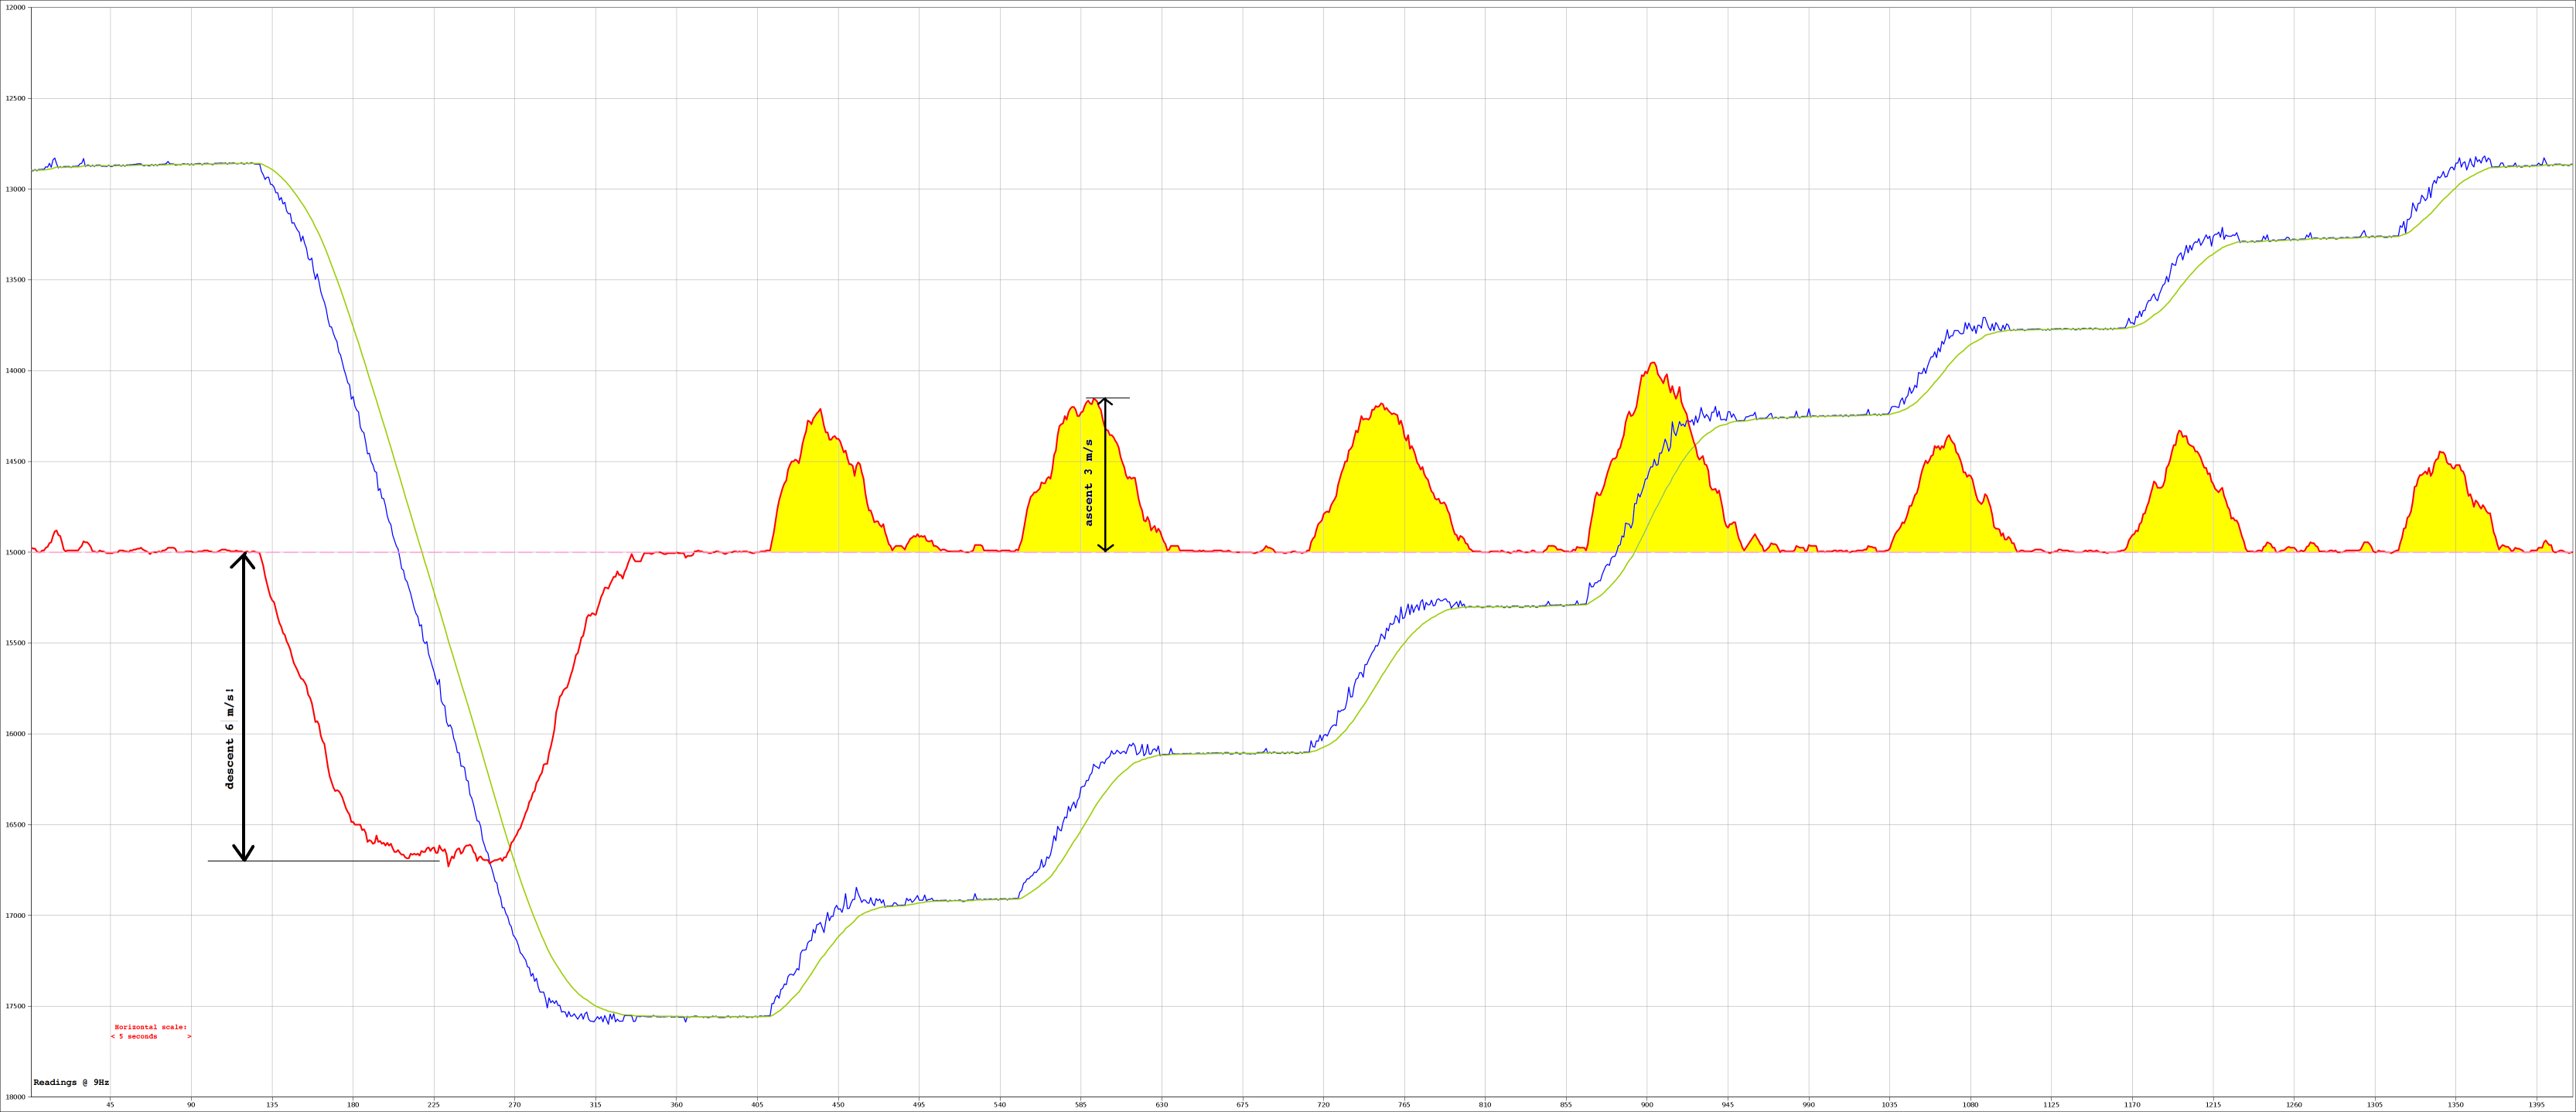
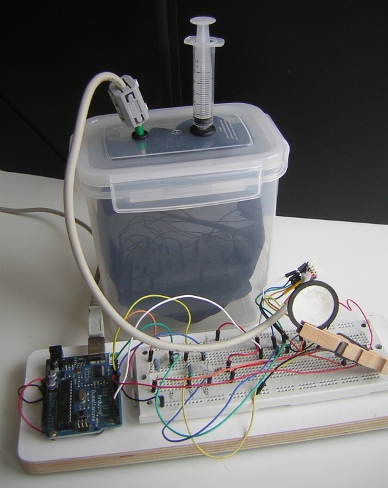 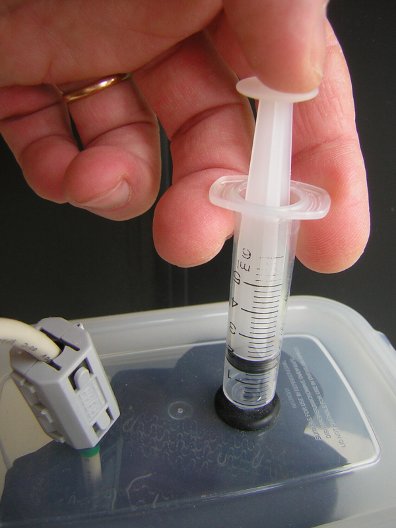 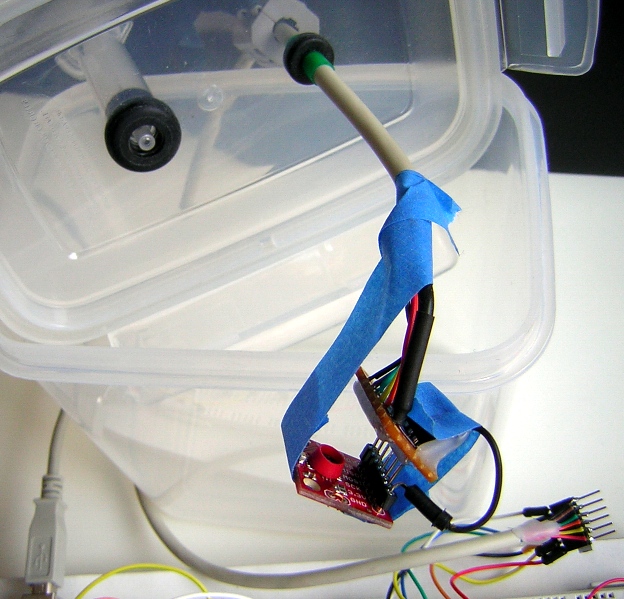  In the pictures above a make-shift temporary connection was used. For a neater serial-to-USB solution see the FTDI board described above. With the µC connected to the breadboard and the sensor placed in the chamber it was easy to simulate quick changes in local air-pressure by manipulating the syringe plunger, while monitoring the response characteristics revealed by the streaming output to the serial computer connection. Unfortunately, the sensor element is sensitive to light (as well as air pressure). This easily introduces confusing errors, so it is essential to keep the sensor in darkness, or at least in a very steady light, while measuring. My black cycling shorts did good service... Below is a graphical analysis of a typical test run, lasting about six seconds. The graph corresponding to the vario signal's magnitude (i.e. the climb-rate) is coloured red, while the smoothed altitude (taken as the inverted air-pressure) is indicated by the green graph. The vario signal values are scaled up by a factor of 30 to exagerate the fluctuations and the Y-axis markings does not apply to this curve. (Click picture to enlarge.) 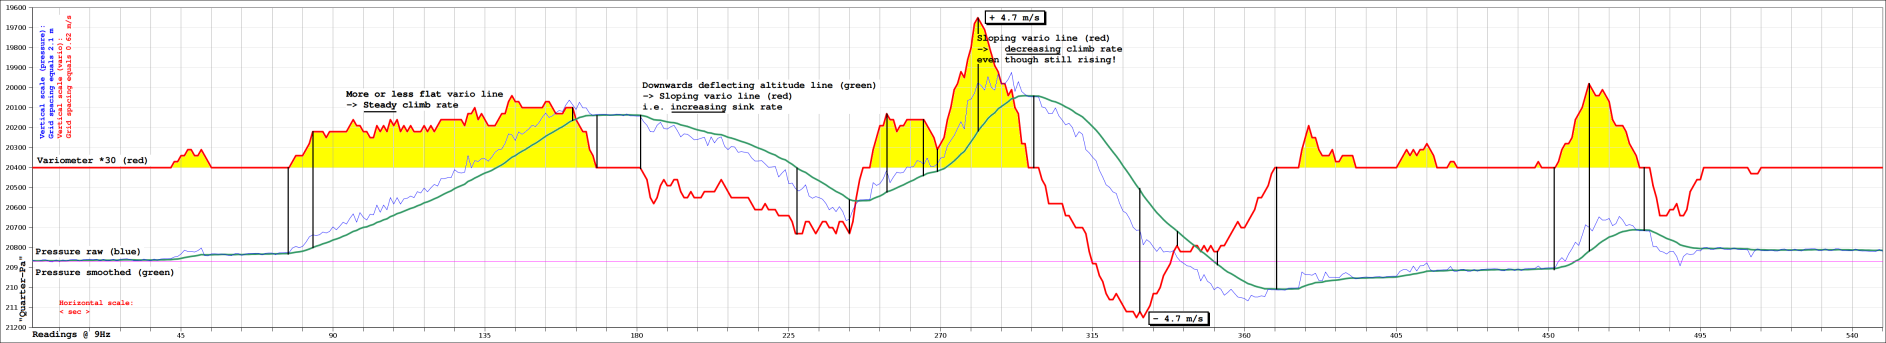 Pseudo field testingAfter much laborious testing and tweaking (basically waiving the sensor up and down all night until exhausting both biceps and enthusiasm), we were eager to observe the vario's response under more challenging conditions by taking it for a ride in the fastest elevator to be found in the vicinity. The 32-story office building "Kista Tower" has elevators with a velocity that approaches 6 meters per second, reaching the top floor in about the same time an ordinary elevator climbs just five stairs. Despite the surging accelerations and retardations, enough to make you seasick soon, the recorded vario-graph from this test session -- first going down 28 stories, then up again in spirts of 2 to 5 stories -- looks "clean" enough, with moderate lag, none-to-minimal overshoot and no discernable oscillations as such. And the beeper sang its staccato tune in falsetto all the while! As in the previous graph the legend is: Blue line = "Cropped Raw Pressure Measurement", Green line = Ditto smoothed, Red line = Vario output signal. Even more interesting, perhaps, is to compare the above with a similar graph recorded in the significantly slower type of elevator of a local 16-story condominium estate. This elevator has a nominal speed of 1.1 m/s, and the session involved two consequtive "roundtrips" between stories 7 and 16, the second time around ascending in three "steps". Even at a cursory glance, this graph reveals a response pattern with certain undesired traits, emphasizing output quirks already detected in previous "desktop" testing. 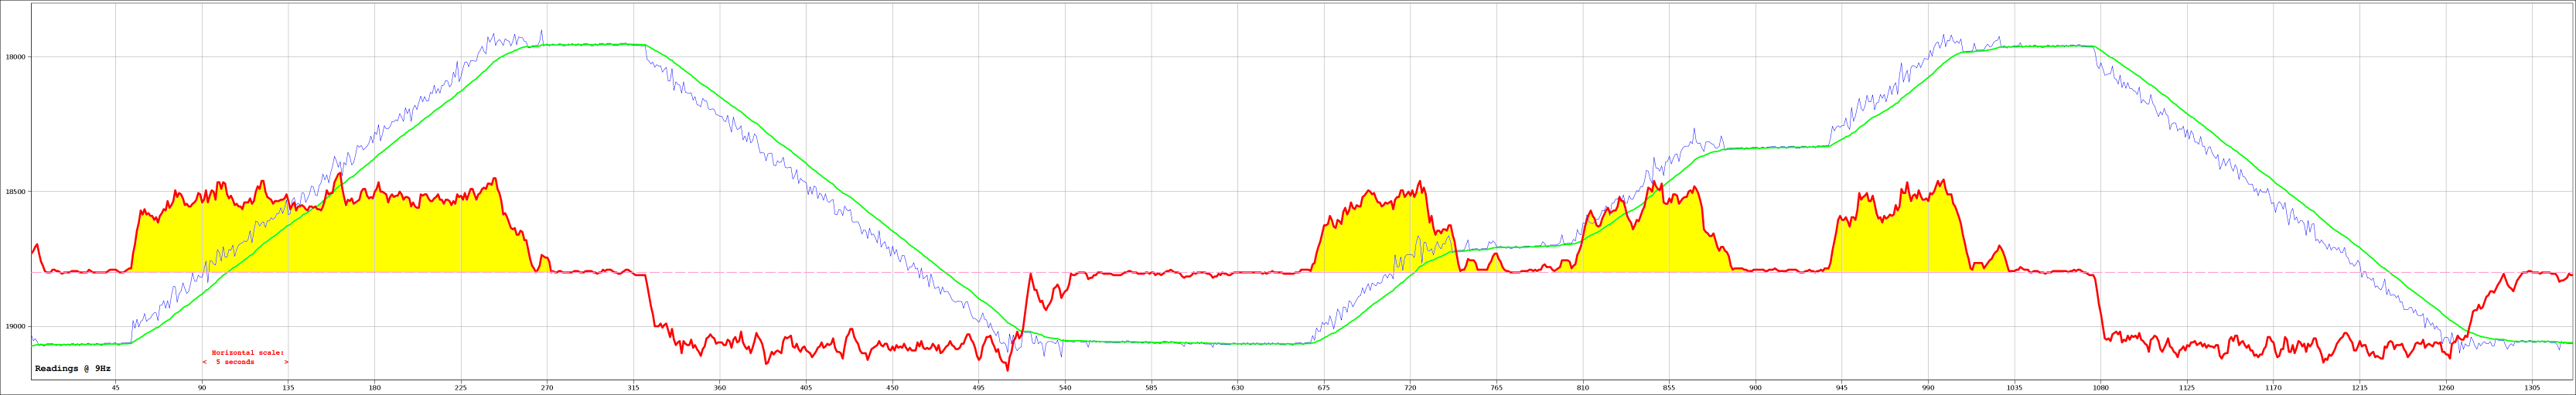 This certainly won't do! Back to the old keyboard... It appeared that the problem basically lay with the "anti-stiction" routine and the naive on/off way this was implemented. A new variable ("trendSet") for the purpose of tracking the apparent trend, that is the "long term" vertical velocity and its direction/sign, was introduced. This is then factored in to set a trend-following value (the "fleeting_state" variable) which is an approximation of the anticipated next mean value (assuming a smooth pressure curve). This value, in turn, becomes the new centre or "neutral value" of the constrainment span determined by the constant "slack". The end result, presumably, should be a more consistent suppression of sensor noise in all the expected variometric states (rising, sinking or keeping elevation). And it worked! Examining the last graph below, which shows the output from a repeat of the session above, but using the revised code (version mx07), it is clear to see that the excessive noise exhibited earlier when climbing or sinking is indeed gone. 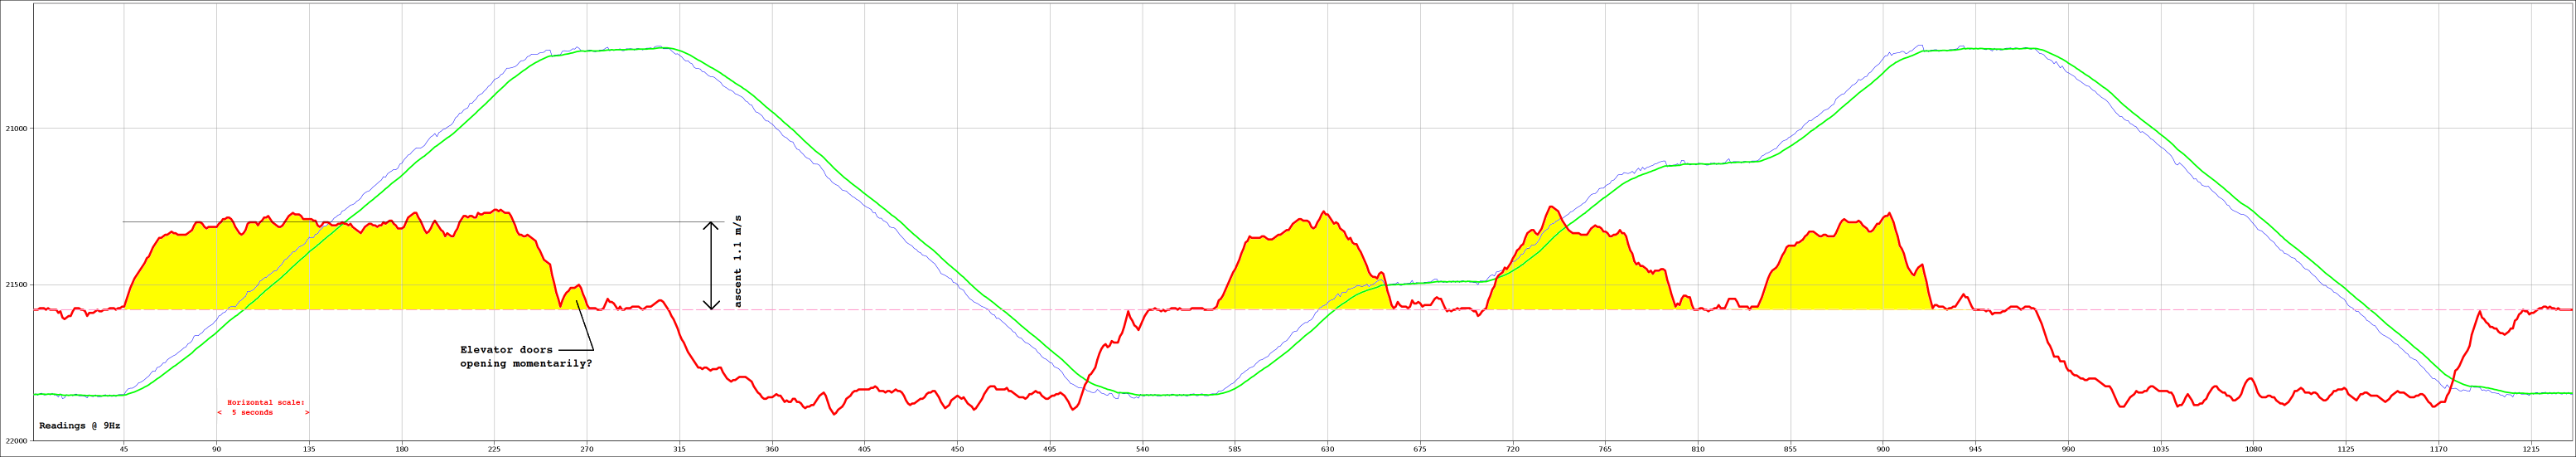 The transmitterThe transmitter part of the first version of this project uses a cheap PMR radio (EXIBEL FX-27, clas ohlson p/n 36-3211), with a tested range (open-field, line-of-sight) of more than a kilometer, i.e. plenty for our purposes. It is also powered by the flight batteries at 4.5v. The very basic glider used as a test-bed for this project has a flat and rather narrow fuselage, so there was no space inside for a bulky transmitter. Instead it was fastened to one side of the flat fuse surface with a balsa cover for protection and "streamlining". 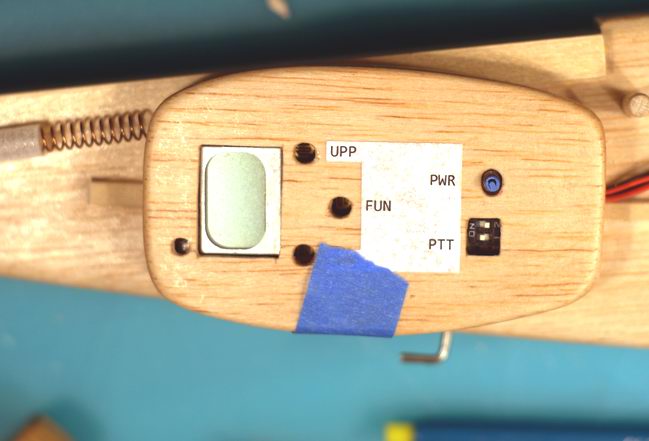 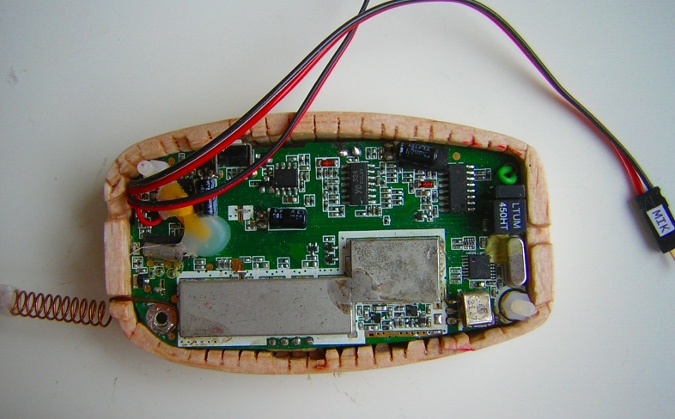 Approximate massesVario circuit boards + power wires: 9 g Piezo + microphone + connecting wires: 4 g PMR radio with its cover + wires: 33 g CommentsSince there is no regular comments feature with Google Sites, you may mail me here instead: xneb.contact@gmail.com Resources |
 | |